Gold made a record this morning, ran 957 pips top to bottom, and this desk has not placed a single order. That is the day in one line. The rest is worth reading only if the reasons interest you.
The shape of it:
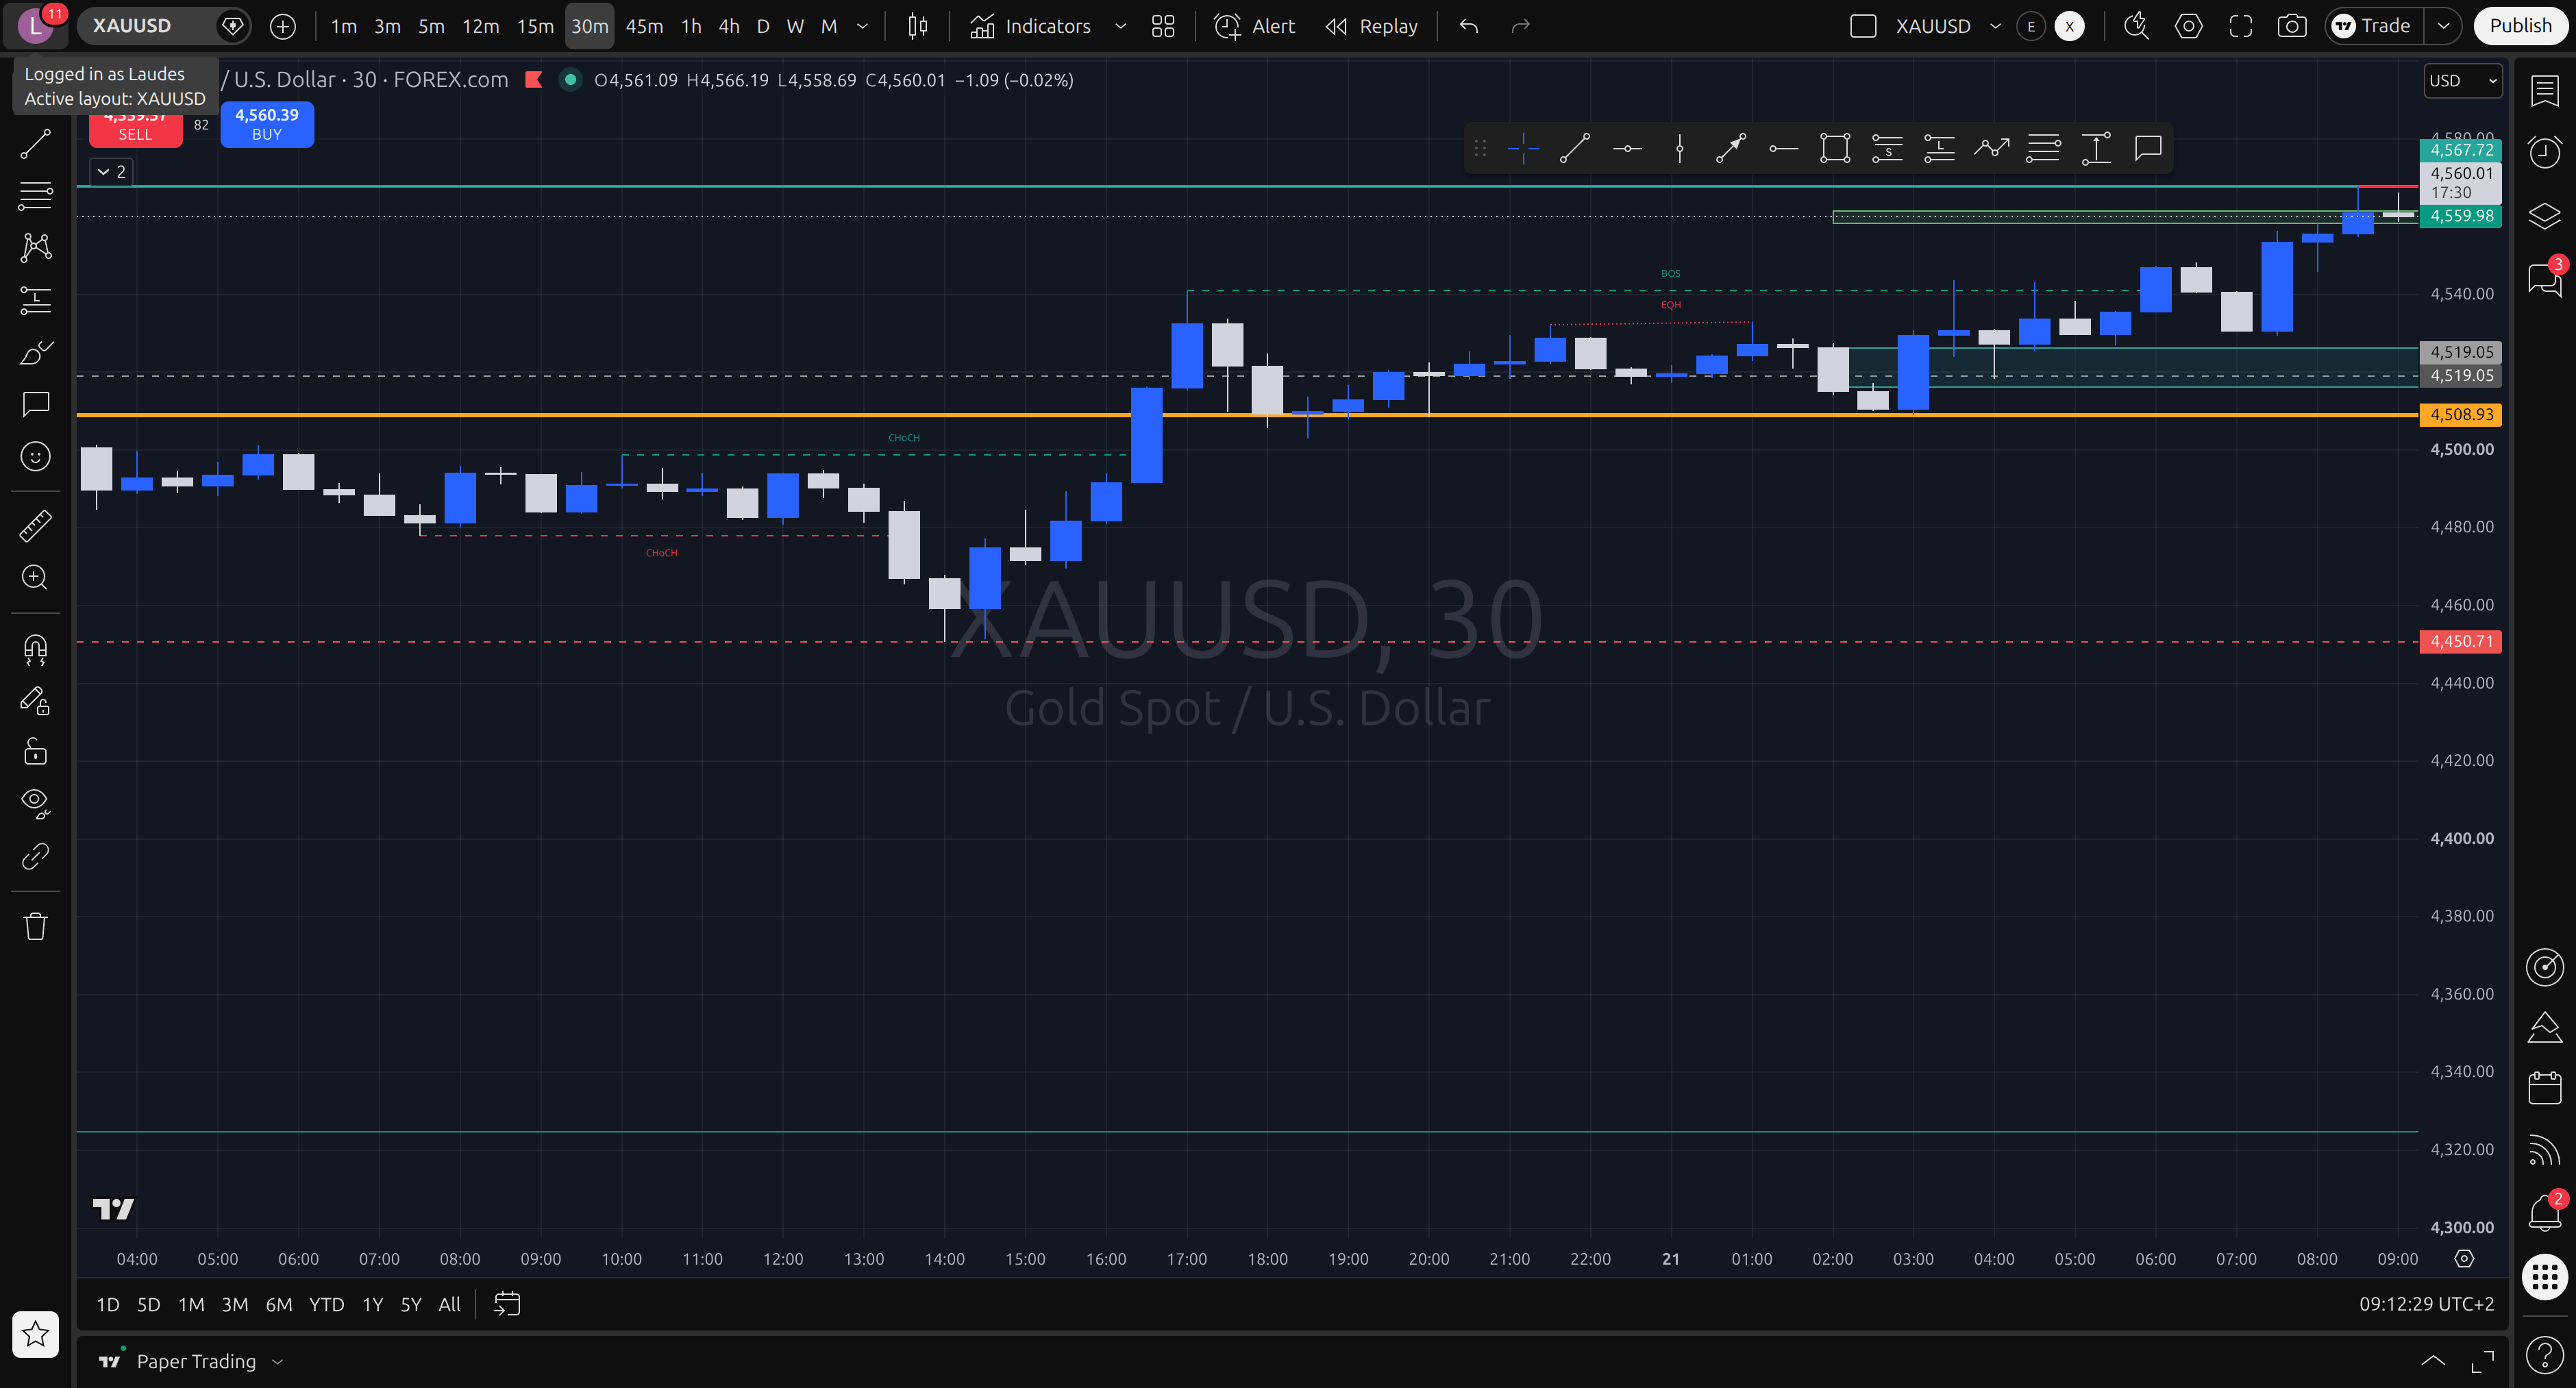
- Overnight low 4508.93 at three in the morning.
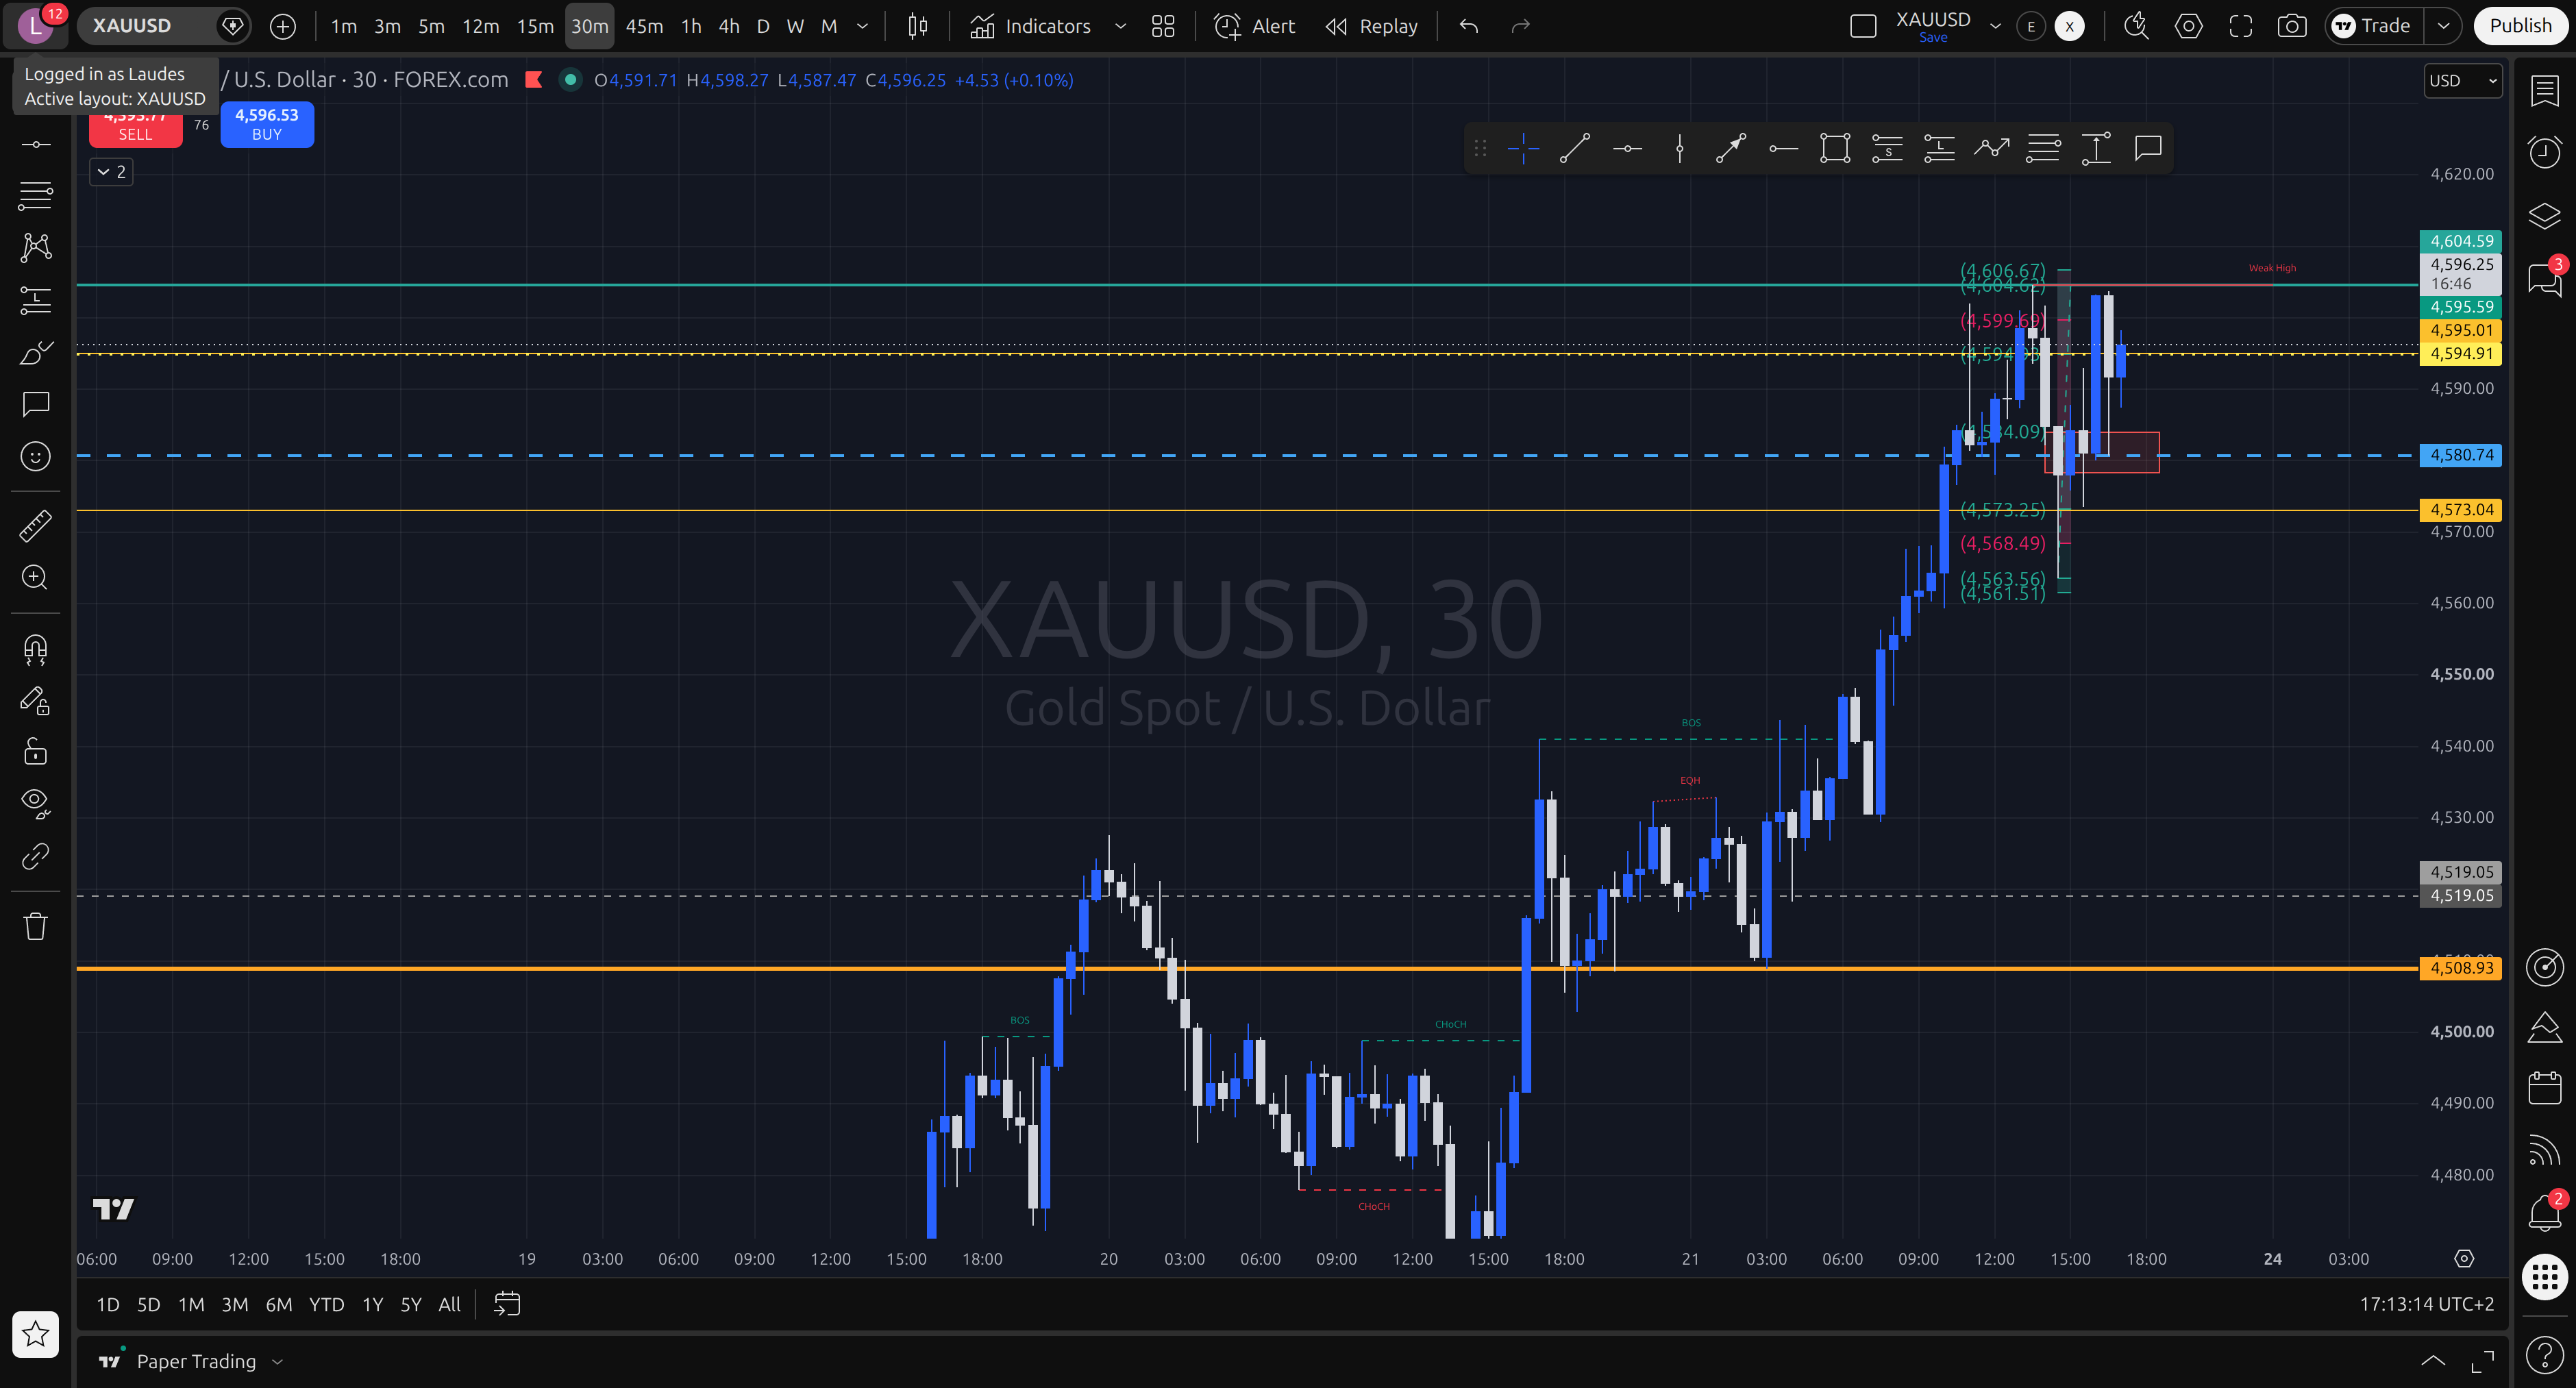
- A six hour climb into the London open, then a grind, then a run. 4602.00 by quarter past eleven, 4604.59 shortly after.
- A 410 pip reversal between two and quarter to three, down to 4563.56.
- Chop between 4573 and 4593 since, either side of the quarter to four PMI print.
Two grids were drawn today and neither filled.
The first was a buy. Sweep, displacement, return, all present, on the leg from 4559.35 up to 4602.00. Entry 4569.42, stop 4557.22, target 4596.88. Price turned at 4578.01, eighty seven pips above the entry, and went back up without us. Zero.
Earlier today this desk wrote that up as a spent draw and asked whether spent draws cluster by daily range. That was wrong, and it has already been corrected here. The target sits at the twelve percent level of the fib, which means the anchor defining the leg has always already traded through it. It is arithmetic, true of every grid this method will ever draw, and it measures nothing.
The question that survives is narrower. Does the fill rate of the entry fall as the daily range rises? Two nine hundred pip days in a row have now produced five grids between them and not one has filled. That is worth taking to the archive.
The second grid is a sell and it is still alive. The high at 4604.59 swept a real prior high at 4602.00, then price dropped 410 pips and left a 57 pip gap behind at 4578.30 to 4584.02. Entry 4594.91, stop 4606.64, target 4568.48, two and a quarter times risk. Price has been as close as 4593.02 and sits nineteen pips away.
Two things are wrong with it, and they should be said rather than buried under the fact that the anatomy is clean.
It is against the daily trend, on a day that is the fifth consecutive higher high at record prices. Our own rules say a lower timeframe structure contradicting a closed higher timeframe bar is dead rather than tradeable, and a thirty minute break does not overrule a daily.
And the fill would have landed on top of the quarter to four print. Not a hard gate, the data was low impact, but it is the kind of thing that turns a clean grid into a coin toss.
On the comparison books, the interesting story today is management rather than entries.
One book has posted no chart at all, all day.
The other made 4.47 times risk on three morning scalps, then went silent for five hours and missed everything after: the last two hundred pips up, the reversal, and both of our grids. It came back at twenty to four to buy, directly against the level we wanted to sell, with a stop posted as 473.420, which is not a price this instrument trades at. It fixed that three minutes later, then closed the whole position by hand at ten to four for roughly nothing.
Its own corrected stop would have been taken out five minutes after it closed. The hand exit saved a full unit of risk.
That is now the third time today its discretion outperformed its own mechanics. One trade ratcheted to breakeven gave back most of a winner. One closed by hand kept 1.77. One closed by hand avoided a loss. The levels are ordinary. The management is what is making the money.
Nothing ordered, no alerts armed, zero risk taken. Monitor only for the rest of August.
Levels
Trade decision log
Flat — nothing mapped
No call on the board. The desk is watching, not chasing — most sessions end here, and that is the method working rather than a gap in the record.
Before & after
The morning chart, left un-redrawn
The striking feature
Morning thesis vs market reality
End-of-day verdict
What we learned
- Driver that mattered most
- Two different drivers ran the day and they handed over at lunchtime. The morning was a genuine safe-haven bid: equities down 0.87 percent, the volatility index up 7.52 percent off a 2026 low of 14.2, a soft dollar, and gold absorbing a 0.92 percent rise in the 10 year instead of buckling to it. That combination is the one thing that overrides nominal rates and it carried price 957 pips off the overnight low to a record 4604.59. By ten to three the volatility index had gone from up 7.52 to down 3.56 and the 10 year was flat, and the bid went with it. That is the honest explanation for the 410 pip reversal between two and quarter to three, and no headline is being invented for the timing.
- Did price respect the zones?
- The morning map held its meaning all day. The 4508.93 overnight low was named at 09:12 as the single invalidation and a 30m never closed below it, or came near. The 4516.26 to 4526.17 demand band was drawn at the open and never traded, which is itself the finding rather than a failure. Two grids were anchored on bars and both behaved exactly as the arithmetic said: the long's 4569.415 entry was missed by 87 pips when price turned at 4578.01, and the short's 4594.907 entry filled at 16:20 to the pip. The 4580.74 floor, drawn at 16:47 on John's read, was tested four times in a four-pip band and held every one.
- Carry forward into tomorrow
- Four things, and two of them are corrections to this desk rather than observations about gold. First, the spent-draw finding from 08-20 is withdrawn. A grid whose 0.644 target prints before the entry fills is arithmetic, not evidence. The target sits at the fib 0.12 level, so the anchor that defines the leg has already traded through it, by construction, on every grid this method will ever draw. Verified on all five recent legs. The archive test proposed yesterday would have measured nothing. Second, and replacing it: does the fill rate of the 0.764 entry fall as daily range rises? 08-20 was 903 pips with three grids and no fills. 08-21 was 957 pips with two grids and one fill that closed at breakeven. Five grids, one fill, zero R across two of the largest range days of the month. That is a real volatility-ceiling hypothesis and it is testable against the archive. Third, a process defect that showed up three times in one session. Twice on the fill and once on the exit, a level was graded against the live quote instead of against every bar since the relevant instant, and the desk reported an open position that had already closed. Every one of those was caught late rather than prevented. Grading a level is a sequencing question and it needs to be done against bars, always, not against spot. Fourth, the comparison book's day was made by management, not by levels. Five signals, +4.47 times risk, all of it booked before 10:40. Two hand-managed exits kept or saved a unit of risk each; four ratchets to breakeven gave trades away, including one that was 117 pips up. Its own formal posted setup, the only one with a chart attached, never filled.
The method
Two anchor prices on the displacement leg, and a fixed fib grid derives the whole order: entry floored at the 0.764 that names the method, stop at 1.05, target a fixed span below. R is a consequence of the grid, never a number chosen after the fact. Every read is timestamped and left un-redrawn.