The desk opened at 09:58 today, an hour into London. The tape had already done its work.
Gold reached 4449.81 at half past two this morning, its highest since the fifth of June. It has fallen 827 pips since. Price is sitting on the low as this is written, around 4368.
What makes the slide worth reading is the shape of it. There was no bounce in it:
- 02:30, the high at 4449.81 on a 251 pip five minute candle.
- Asian session, a steady staircase down. Every rally off the way died inside 25 to 45 pips.
- 07:30 and 07:40, two 15 minute bars of 138 and 142 pips take it through 4390.
- 09:00, London opens and the high of the session is 4381.81. It has been lower highs since.
- 10:00, the low at 4367.14.
Seven and a half hours, one direction, no retracement worth selling into. That last part is the problem, and it is the reason there is nothing to do at the moment.
The method here needs a pullback. Sweep, displacement, then a return into the imbalance the displacement left behind, and the entry sits at the 0.764 of that leg or better. This morning there was no return. The bias is short and the price to be short at has not existed since before breakfast.
So where does that leave the levels.
Price is now sitting on a shelf built from two separate things arriving at the same place. Yesterday's low is 4362.56. Last week's high is 4371.97. Price is between them. A market that has run 827 pips in a straight line and then arrives at first support is not a market to sell in a hurry.
There is a second reason to be careful, and it cuts against our own bias. The daily has not broken. Today's low at 4367.14 is 46 pips above yesterday's low, and the run of higher lows going back to the fifth of August is still intact. So the five minute chart is bearish, the daily is not, and 4362.56 is the level that settles the argument. A 30 minute close below it breaks the daily and opens 4356.85 and then 4313.51. Until that happens, every short is fighting the higher timeframe, which is the exact mistake this desk made on Tuesday and was corrected on.
The cross market picture has turned since yesterday, and one line in it stands out.
Yesterday silver led gold higher, up 2.02 percent against gold's 1.70, and the whole metals complex was bid together. Today silver is down 1.34 percent while gold is roughly flat. The complex has split, and silver is generally the side that goes first. Alongside that, the dollar is pressed against 100.00 with a breakout piece written about it this morning, and oil has dropped 1.37 percent on a 17.4 million barrel US crude build. That last one matters more than it looks: the overnight dollar bid was partly an oil driven inflation story, and the oil half of it just went away.
The geopolitics are loud and doing nothing. Trump restated his claim of total US control of the Strait of Hormuz, Iran refuted it, and gold did not move on either. Restated positions are already in the price. Our news tool flags it as advisory rather than as a gate, which is the correct call and a change we made yesterday.
The clock is the last piece and it is tighter than usual. Producer prices land at half past two with a hard blackout from half past one to half past three. London gets three and a half hours from here, then nothing, then the window reopens at half past three with two and a half hours of the New York overlap before the tape thins out.
Nothing is ordered and nothing is armed. Watching for one of two things: a pullback that puts a sellable level above 4381.81, or a 30 minute close under 4362.56 that breaks the daily and builds something new underneath.
10:30. Correcting the line above: something is ordered now.
The trader placed a sell limit at 4374.94, stop 4379.57, target 4365.94. The desk did not call it. Price is 4370 and the limit sits 50 pips above, unfilled.
We have one objection and it is arithmetic rather than opinion. That order is 1.94 times risk. Our floor is 2.25, and the reason it falls short is the reason the rule exists: the limit sits below the 0.764.
The disagreement is about where the top of the fib goes. He anchored it at 4378.83, which is the open of the candle that dropped. We read the accumulation high as 4381.81, the high of the base that produced the drop. On the fifteen minute chart the sequence is a rally into 08:45, a base holding 4372.21 to 4381.81 through 09:00 to 09:30, then a departure candle of minus 8.53 at 09:45. Rally, base, drop. Supply runs from the base high to the departure open, so 4378.51 up to 4381.81, and the top of that zone is the same number as the top of the fib.
Move the anchor and the grid moves with it:
- 0.764 becomes 4377.65 rather than 4375.39.
- The proximal edge of supply at 4378.51 sits above that, so it pulls the entry up to 4378.51.
- Stop 4382.69, target 4367.17.
- 2.71 times risk instead of 1.94.
Same idea, three and a half dollars higher, forty percent more payoff. An imbalance is allowed to pull an entry up. It is never allowed to pull one down through the 0.764, and that is the one rule here we have agreed not to reopen.
There is a second thing he should see before it fills, and it argues the other way. There are unfilled gaps above this market, at 4385.69 to 4386.76 on the fifteen minute and 4385.69 to 4393.22 on the thirty. His stop at 4379.57 sits between price and both of them. That costs eight points on our scorecard and it is never a veto, but it is the exact shape that cost us a trade on the thirty first of July, where a stop sat just under an unfilled gap and got collected on the way to filling it.
Being straight about the whole picture: corrected to 2.71, and assuming the inducement forms, we score this around 73 percent. Our lean-to-take line is 80. What holds it down is a thin external sweep, since the only liquidity taken before the drop was a two pip run over the previous high, and those overhead gaps.
So the verdict is that the order as placed is weaker than our floor, the corrected version clears it comfortably, and even the corrected version is under our take line. He decides. We do not touch orders.
One more thing worth recording, because it arrived independently.
The first comparison book posted its opening setup of the morning at 10:10: a sell zone running roughly 4376.4 to 4378.8, read off its own chart image so treat those numbers as indicative. That zone contains our corrected 0.764 at 4377.65 and our supply edge at 4378.51. It sits above the limit on our chart.
Three methods, one place. That has not happened yet today.
The second book meanwhile confirmed at 10:13 what our tape had already shown. It bought this shelf twice, at 4377.995 and again near 4373.97, and posted 'SL hit' on the second one. Both longs are dead. Its second stop sat at 4364.95, which is 24 pips above yesterday's low, and the low so far is 4364.20.
So the book that was buying support has lost twice, and the book that is selling the rally has just marked the same zone we did.
11:15. The order above is long gone and the day has turned into a lesson about stops.
What happened to it:
- 10:34, the sell limit at 4374.94 filled.
- 10:40, it is seven pips onside, going nowhere.
- The stop gets tightened to about 4376.27, eight pips above entry.
- 10:45, one candle runs 4373.54 to 4379.19. Fifty six pips in five minutes.
- The tightened stop is gone. Loss about 350 dollars rather than the 1,832 the original stop would have cost.
Then the comparison book did the identical thing, twenty minutes apart and with no contact between them. It sold at market at 4375.5 with a stop at 4379, moved to breakeven at 10:42, and posted a breakeven exit at 10:52. Same entry error, same shake-out, same candle.
Two discretionary traders, one method each, both short and both right about direction. Neither made a cent.
The common thread is not the entry, though both entries were below the level our rules would have used. It is the stop. Eight pips of room on a tape where the last eight five minute bars measured 19, 21, 38, 39, 57, 38, 26 and 38 pips. That stop was inside the noise, not outside it.
There is a rule for when to move a stop and it did not fire here. It says to move it once price has crossed the halfway point of the leg in your favour. Halfway was 4373.01. Price never got there. The stop was moved on hope rather than on the trigger.
We are not going to pretend that is a small thing, because the same move on 6 August turned a full loss into a green day. Trailing is right. Trailing early is not the same activity.
After that the desk went looking for a sweep above 4381.81 that never came, and by eleven the tape had gone quiet between 4373 and 4379.
So we reverted to structure, and the setup now on the chart is the best one of the day.
The fib runs from 4364.17 up to 4412.26. That upper anchor is worth explaining because it is not a number anyone chose. A gap opened on the thirty minute chart at 03:30 between 4414.12 and 4419.23 and has never been filled. The highest price traded since it opened is 4412.27. That is the ceiling six hours of tape has respected, and it is where the fib ends.
The grid:
- 0.764 at 4400.91, which sits within a third of a pip of the top of an unfilled fifteen minute gap at 4389.40 to 4400.94. Entry there is 2.25 times risk.
- 0.88 at 4406.45, the deep edge. Stop 4414.66, target 4375.52, 3.79 times risk.
- The trader's own order sits at 4406.45 with a deeper target at 4369.72, which is 4.48 times risk.
Risk on that is 82 pips. Not eight. That is the part that matters after this morning.
Two honest problems with it.
The stop at 4414.66 sits five pips inside the unfilled gap that starts at 4414.12. Price reaching for that gap collects the stop on the way. This is the third time today a stop has been parked in front of an unfilled imbalance, and the first two both got taken.
And the entry is 236 pips above the current price. Producer prices land at half past two with a blackout from half past one, so a resting order out there will most likely fill inside the news window. That is not a judgement call, it is a rule, and the decision is better made now than at twenty five past one. This is a New York trade.
One last note, and it argues against us. The indicator we read structure from has labelled the day's high a weak high and the 4356.85 low a strong low. In its language that means it expects the high to be taken and the floor to hold. We are not treating it as a veto, but it is on the chart saying the opposite of what we want, and leaving that out would be dishonest.
The second comparison book has now lost three longs into this same shelf and says it is done until New York. The first has moved its sell zone up to 4407 to 4411, which is within a few pips of where our own grid wants to sell. Two methods, no contact, same place.
13:30. Blackout open, desk flat, nothing lost.
The order that was sitting at 4400.97 was pulled at twenty five past one, on our recommendation, and the tape settled the question about four minutes later. The high for the whole session was 4396.66. Price never came within 43 pips of the limit. It was not a missed fill, there was no fill to miss.
Worth walking through how the afternoon setup was built, because it is the first thing today that followed the rules end to end.
The trader replotted it around a quarter past eleven and corrected his own entry twenty minutes after that. The corrected version:
- Fib anchored 4364.17 to 4412.26.
- Sell limit 4400.97, which is the 0.764 plus six tenths of a pip. Above the floor, not below it.
- Stop 4414.64, target 4369.72. Two point two nine times risk.
- 137 pips of stop. Not eight.
Every earlier entry today sat below the 0.764. His first at 4374.94 by 27 pips, the comparison book's at 4375.5, a market sell panel that briefly showed 4376.29. This one sat above it, and it also sat within a third of a pip of the top of an unfilled fifteen minute gap running 4389.40 to 4400.94. Selling the completion of a gap fill rather than a number on a grid.
The upper anchor deserves a note. A gap opened on the thirty minute chart at half past three in the morning between 4414.12 and 4419.23 and never filled. The highest price traded since then is 4412.27. That is where the fib ends. Not a level anyone picked, a ceiling six hours of tape had respected.
Then the market did something worth recording, because it happened in the order it was called.
- 11:08 to 11:51, price coils in an 84 pip range. Ten touches build a shelf at 4381.9 to 4382.3, eight build one at 4376.4 to 4377.2.
- 11:51, we name both and arm them. The trader's read: coiling is good, it creates structure for an inducement. He was right.
- 11:55, a 48 pip bar takes the upper shelf. Ignition.
- 12:37, equilibrium at 4388.21 crosses. Premium from there, which is the location requirement satisfied.
- 12:43, price enters the gap. The fuel leg.
- 13:15, 4396.66. Forty three pips short of the entry, and that was the high.
Four calls in sequence, all in order, and then it stopped.
The pull decision came down to one number rather than a rule. The stop was 137 pips. Yesterday's inflation print produced a five minute candle of 493 pips. The print bar was three and a half times the entire risk parameter. A position entered at 13:29 would have had its stop rendered meaningless four minutes later, whatever the structure said.
We have the counterexample from yesterday too, and it argues the same way. The setup we declined on the twelfth went on to make close to four times risk, and its stop survived that 493 pip candle by five pips. That is a coin landing the right way up, not a trade working. If it is not evidence for taking the trade, it is not evidence against skipping this one.
So: flat, observing, nothing armed. Producer prices at half past two. The overlap reopens at half past three with two and a half hours in it, and the fib survives as long as 4364.17 holds and 4412.26 stays untaken.
The two comparison books both closed out before the window.
The first sold at 4375.5 at 10:36, moved to breakeven six minutes later and was taken out flat at 10:52, on the same candle that took the trader out. It has been idle since, holding a sell zone at 4407 to 4411 that price never reached.
The second is the day's winner and its shape is instructive. It bought this shelf three times. The first two were stopped, at 4368.047 and at 4364.95. The third worked and it booked 200 pips out of it, closing before one o'clock with a note that price was close to a sellers zone and it would look again in New York.
Three attempts, two losses, one win that paid for both. Nobody who watched only the third trade would understand the day.
One more thing about that book, since it is the cleanest lesson available. It set breakeven twice today. At 10:42 the buffer was a handful of pips and the stop was gone inside ten minutes. At 12:10 the buffer was about 112 pips and the trade ran to target. Same action, different distance, opposite outcome. The trader made the identical move at 10:40 with eight pips of room and got the identical result.
That is the day so far. Two losses, one pulled order, and a rule that finally got followed.
15:00. The producer price figures landed and the desk has to write down something uncomfortable.
The order we recommended pulling would have worked.
Here is the sequence, and the numbers are off closed bars:
- 14:25, price runs 86 pips into the release.
- 14:30, the print. A 205 pip candle. Open 4391.12, high 4401.35, low 4380.81, close 4391.96.
- The high went 3.8 pips through the 4400.97 limit we had cancelled 64 minutes earlier.
So it would have filled. The stop at 4414.64 was never remotely threatened, the trade used about three percent of its risk, and at the low it would have been 202 pips onside, a touch under one and a half times risk. It was showing roughly 1,785 dollars of open profit an hour ago.
We pulled it. That decision cost that money. We are not going to bury it in a paragraph about process.
The reasoning has not changed, though, and it was made before the outcome rather than after. The stop was 137 pips. Yesterday's inflation print produced a 493 pip candle. Today's produced 205. A trade whose entire risk parameter is smaller than the routine range of the event it is sitting through is not expressing a view, it is taking a position on a coin. Today the coin landed the right way up.
We said exactly this yesterday, when the setup we declined went on to make close to four times risk with its stop surviving by five pips. It has to mean the same thing on a day when it costs us.
But there is something that should be flagged rather than smoothed over: that is now two consecutive sessions where our news gate has stopped us out of a trade that would have won. Two is not a pattern and we are not changing a rule on it. It goes in the week review as an open question, and the way to answer it is to keep counting.
Then the same two minutes produced the other half of the argument.
The second comparison book bought gold at 14:29. One minute before the release. It posted an entry with a stop at 4380.760 and a target at 4400.00, then closed at 14:31 for a claimed 120 pips.
The low of the candle it profited from was 4380.81.
Its stop survived by half a pip.
That is the whole case for the gate in one trade. A book banked 120 pips on a position that came within five hundredths of a dollar of being stopped out completely, on the very candle that paid it. Nobody reading the result would know how close it was. We only know because we were watching the tape rather than the announcement.
So both things are true at once. Our rule cost us real money today. The alternative was a coin flip that happened to land. Which of those matters more is a question about many samples, not about this afternoon, and anyone who tells you otherwise is reading one outcome and calling it a lesson.
Two corrections on our own reporting while we are here.
At 14:31 we described the print bar as 141 pips. It was 205. We measured it while it was still open, which is the second time today we have quoted a number off an unfinished window. The first was just before eleven, when a lookback reaching back three hours reported a price sweep that had not happened. Both were caught inside a minute and nothing was traded on either, but a desk that measures badly twice in one session should say so.
Where things stand now: flat, nothing ordered, still inside the window until half past three. Price has recovered to 4396 and the session high is 4402.05. The structure we have been working from survives, since the print never reached 4412.26 and never went near 4364.17.
The next decision is at half past three, when two and a half hours of the New York overlap open up. Two shots are already spent today and neither made money. A third has to earn its place on the setup in front of us, not on the fact that the afternoon owes us something.
16:25. The trade we told him to cancel reached its target.
Full accounting, measured from the earliest moment the order could have filled:
- Entry 4400.97, which the print reached at 14:30.
- Highest price after that: 4402.05. The stop at 4414.64 was never within 128 pips.
- Low: 4366.73, at ten past four.
- The 4369.72 target was first touched at 16:05.
That is 312 pips, 2.29 times risk, 4,156 dollars on the size that was on the ticket. At its worst moment the trade was three percent underwater.
We recommended cancelling it at 13:26. That recommendation cost the whole thing.
The reasoning behind it has not changed and we are not going to keep relitigating it in public. The stop was 137 pips and the event it would have sat through produced a 493 pip candle the day before. That is a decision about a distribution, not about this outcome. It was the right call on the information available and it lost money.
What is worth writing down is the count, because it is starting to look like something.
- Twelfth of August: the gate kept us out of a setup that went on to make close to four times risk.
- Thirteenth of August: the gate kept us out of a setup that made 2.29 and 4,156 dollars.
Two for two. Two samples cannot overturn a rule and we are not changing anything on the strength of it. But it is now the most important open question on this desk and it goes into the week review as a question about the rule rather than a comment about the day. If it is four for four by Friday, the gate needs measuring properly rather than defending.
The counterweight from the same afternoon still stands and it is not a small one. The second comparison book bought one minute before the release, banked 120 pips, and its stop survived the low of the candle that paid it by half a pip. Nobody looking at its result would know that. We only know because we were reading the tape rather than the announcement. A rule that avoids that is not obviously wrong just because it also avoided today's winner.
Three other things about the day, briefly.
The setup itself was called correctly at every stage. The coil that formed between eleven and midday was named as the structure that would produce the move, its liquidity shelves were mapped, the break of them at 11:55 was flagged as ignition, equilibrium and the imbalance were called as price passed through them, and the level was reached. The map was right from beginning to end. It made nothing.
The trader's own read of the coil, that it was building structure for an inducement, was correct and was the thing that made the afternoon legible.
And we got our own measurements wrong four times, catching two of them before they reached him. Once from a lookback window reaching three hours further back than intended, once from quoting a candle while it was still forming, once from a truncated window that would have reported a false session low, and once from counting target touches that happened before the setup existed. Every one is the same mistake: trusting a window without checking what it contains. That is going in the end of day notes as a permanent guard rather than four separate fixes.
Now: flat, price 4374, and the trader has a new thesis on the four hour chart. The range since the eleventh runs 4356.85 to 4449.81 and he expects the floor to give way. The honest reading is that it is an ascending range, with three higher lows and three higher highs, which usually breaks upward, and that a break of 4356.85 lands directly in unfilled four hour demand at 4344.25 to 4356.85. Against that, today printed a large bearish daily candle from the top of the range off a ten week high.
It is a tomorrow trade. The floor is 178 pips away with ninety minutes of the overlap left. Alarms are set at each step down to it so it can be answered whenever it happens.
16:55. Correction, and it is a large one. Everything written above about a flat day is wrong.
The trader has been trading all afternoon and this desk did not know. He showed the broker ledger at five to five and it reconciles to the cent.
Four closed shorts today:
- 10:48, 427 units out at 4376.27 from 4375.45. Minus 350 dollars. This is the one we knew about.
- 15:54, 200 units out at 4376.32 from 4376.73. Plus 82.
- 16:05, 400 units out at 4375.22 from 4375.31. Plus 36.
- 16:30, 1600 units out at 4358.81 from an average of 4371.395. A hundred and twenty six pips. Plus 20,136 dollars.
Balance 366,695 to 386,598.86. The day made 19,903.86 dollars.
Now the part we have to write down about ourselves.
From 15:54 onward this desk reported flat, nothing live, zero trades. It said so at 16:02, 16:06, 16:15, 16:25, 16:30, 16:44 and 16:47. Every one of those was false.
The worst of them was at 16:16, where we wrote that the thesis had paid out and we were not in it. He was in it. Fourteen minutes later that position closed for twenty thousand dollars. We described the single biggest event of the day as an absence, in public, while it was happening.
The cause is not subtle and it is a rule we already had. The position of record is the broker. Not the chart, not price action, not the desk's own bookkeeping. We applied that rule correctly at half past ten, when we asked him to confirm a fill rather than infer one from the tape. Then we cancelled an order at 13:26, assumed flat, and never asked again for three and a half hours.
The runbook says to ask for the order list after any gap in attention. It was written with his attention in mind. Today the gap was ours.
So the fix is a step rather than a resolution: from tomorrow, a broker-state question belongs in every check where this desk believes it is flat, not only after a fill it already knows about.
There is a second thing here and it matters more than our bookkeeping.
His unconventional trades made 19,903 dollars. The setup we built by the book, scored at 83 percent, entered six tenths of a pip above the 0.764 with the stop at the 1.05 and a risk multiple of 2.29, made nothing. We recommended cancelling it and its paper result was 4,156.
Discretion beat the method by roughly five to one today, and the method produced a flat book.
That is not a complaint about the rules and it is not a reason to abandon them. It is the exact thing this project exists to measure. The 16:30 winner was scaled into a falling market at an average of 4371.395. That is not a limit resting at a fibonacci level and it is not in the written method anywhere. It goes into the record as a labelled discretion sample, with the number attached, and it will mean something when there are fifty of them rather than one.
Today the honest summary is short. The desk was right about direction all day, made nothing from it, missed that the trader was making twenty thousand, and has the ledger to prove all three.
Levels
Trade decision log
Flat — nothing mapped
No call on the board. The desk is watching, not chasing — most sessions end here, and that is the method working rather than a gap in the record.
Before & after
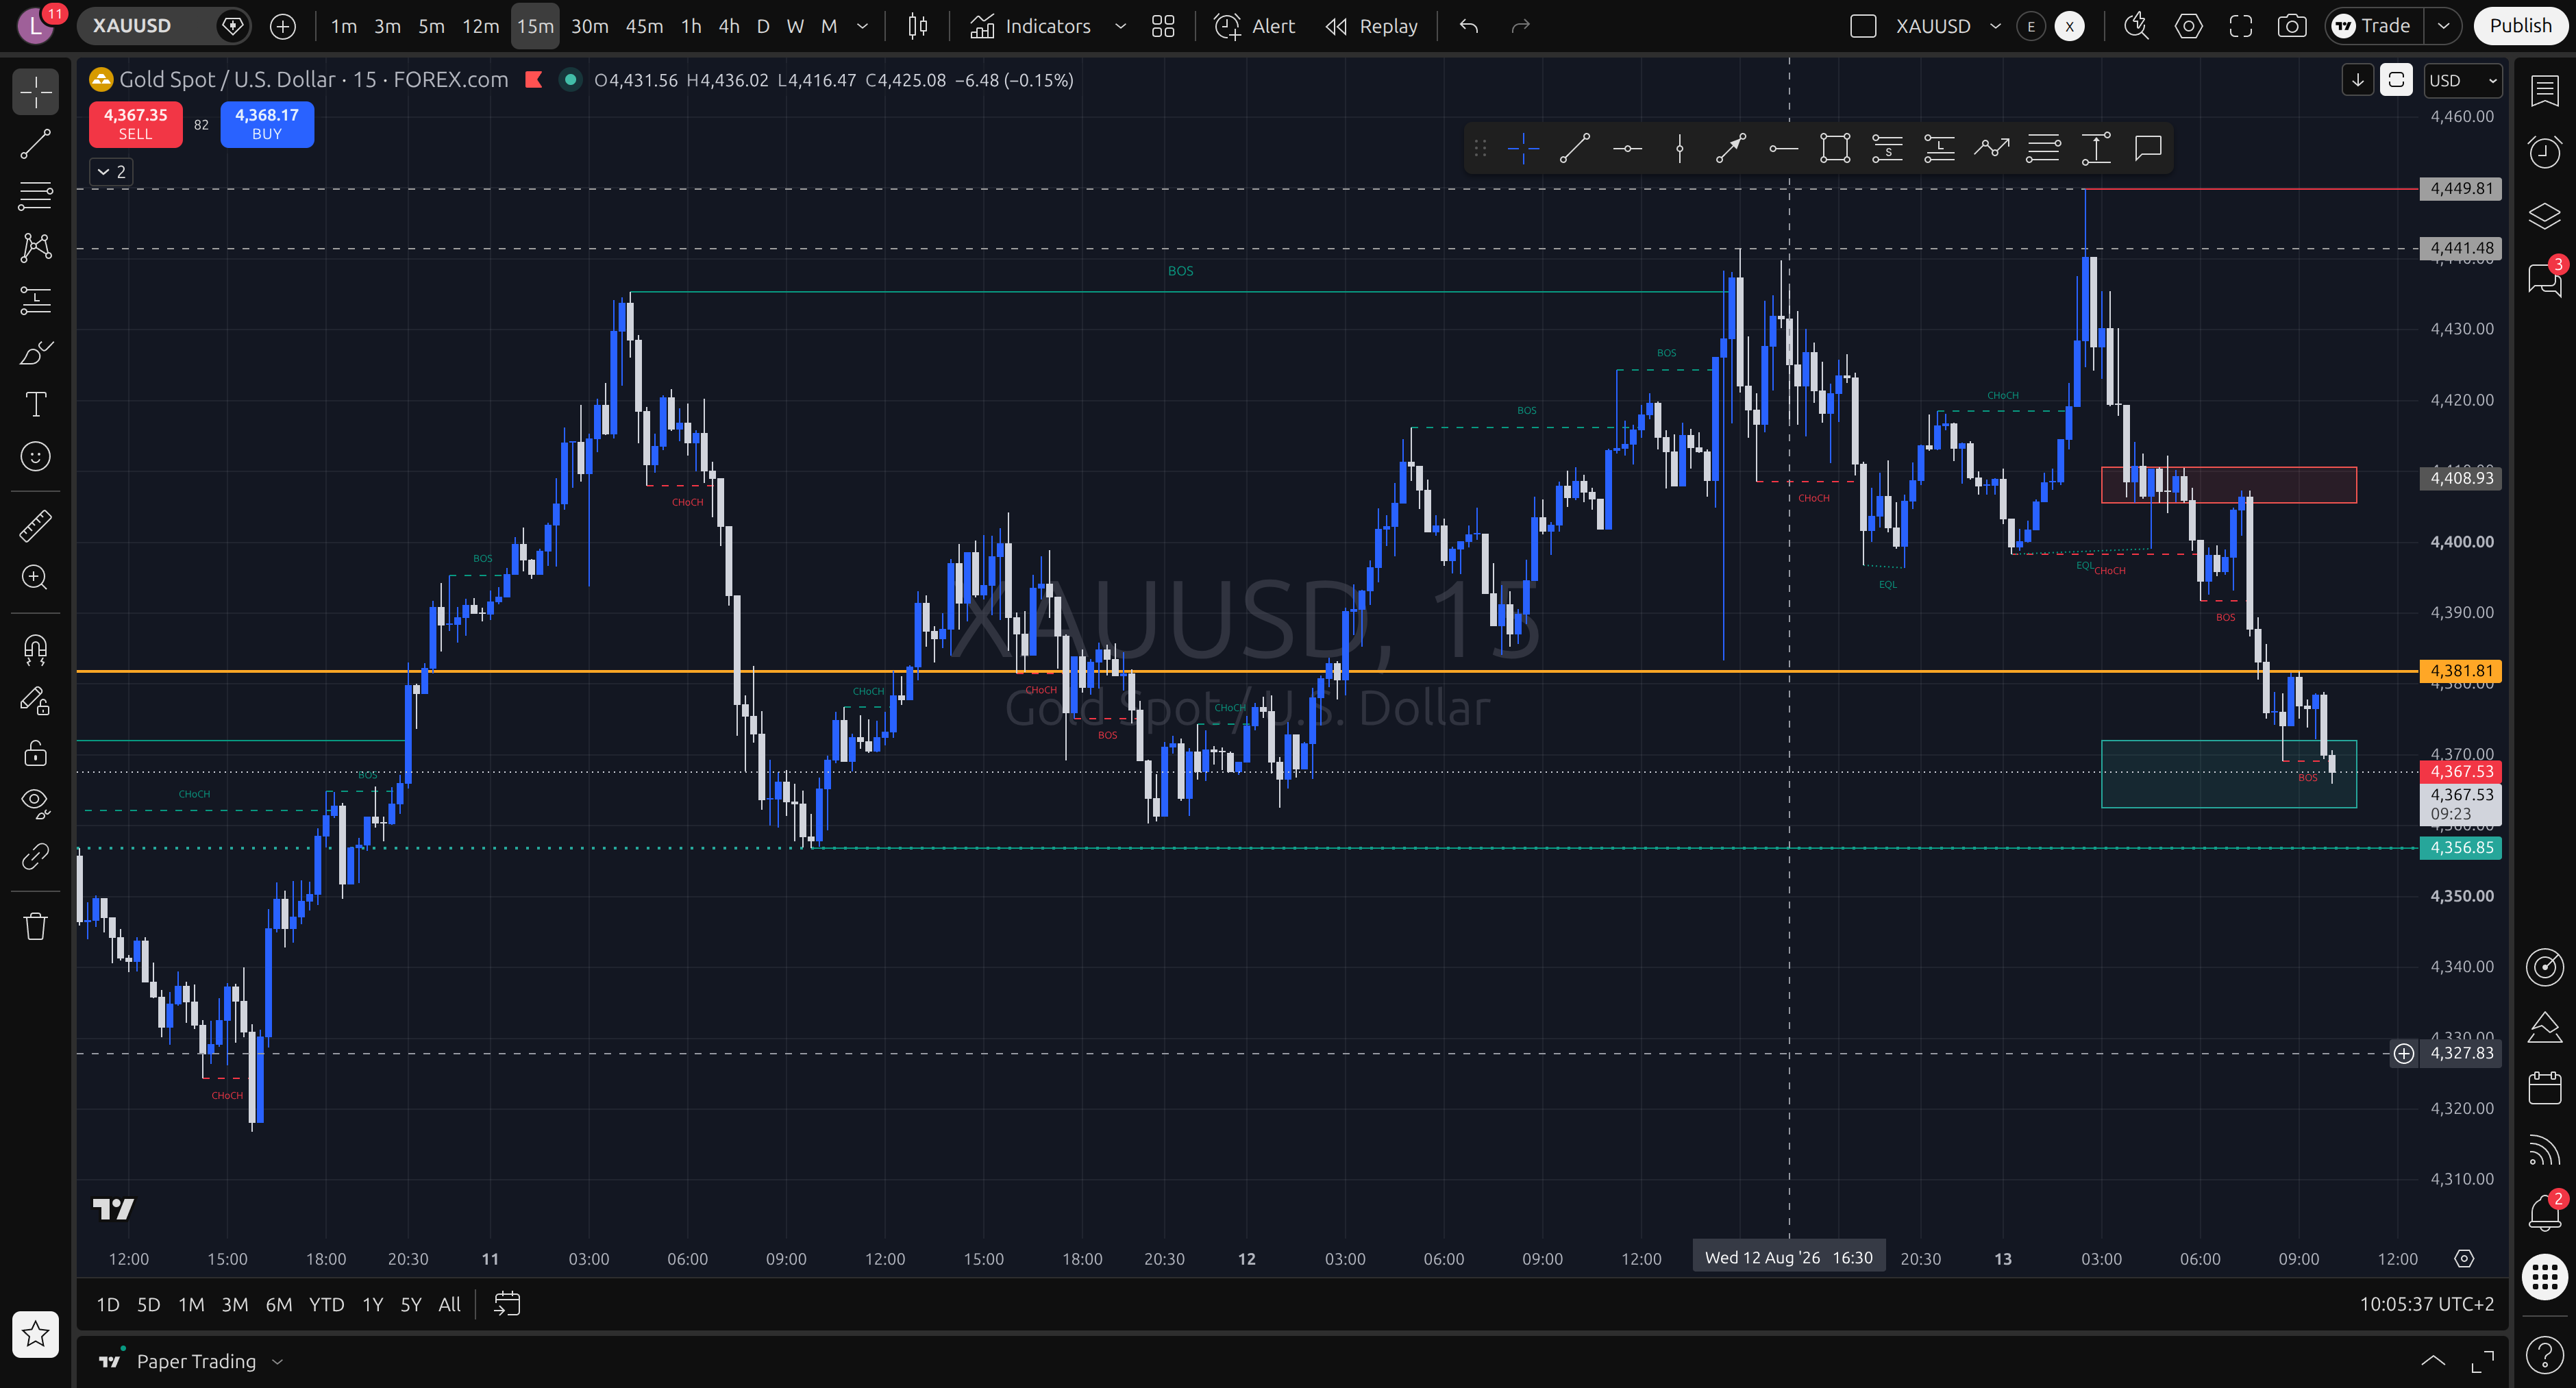
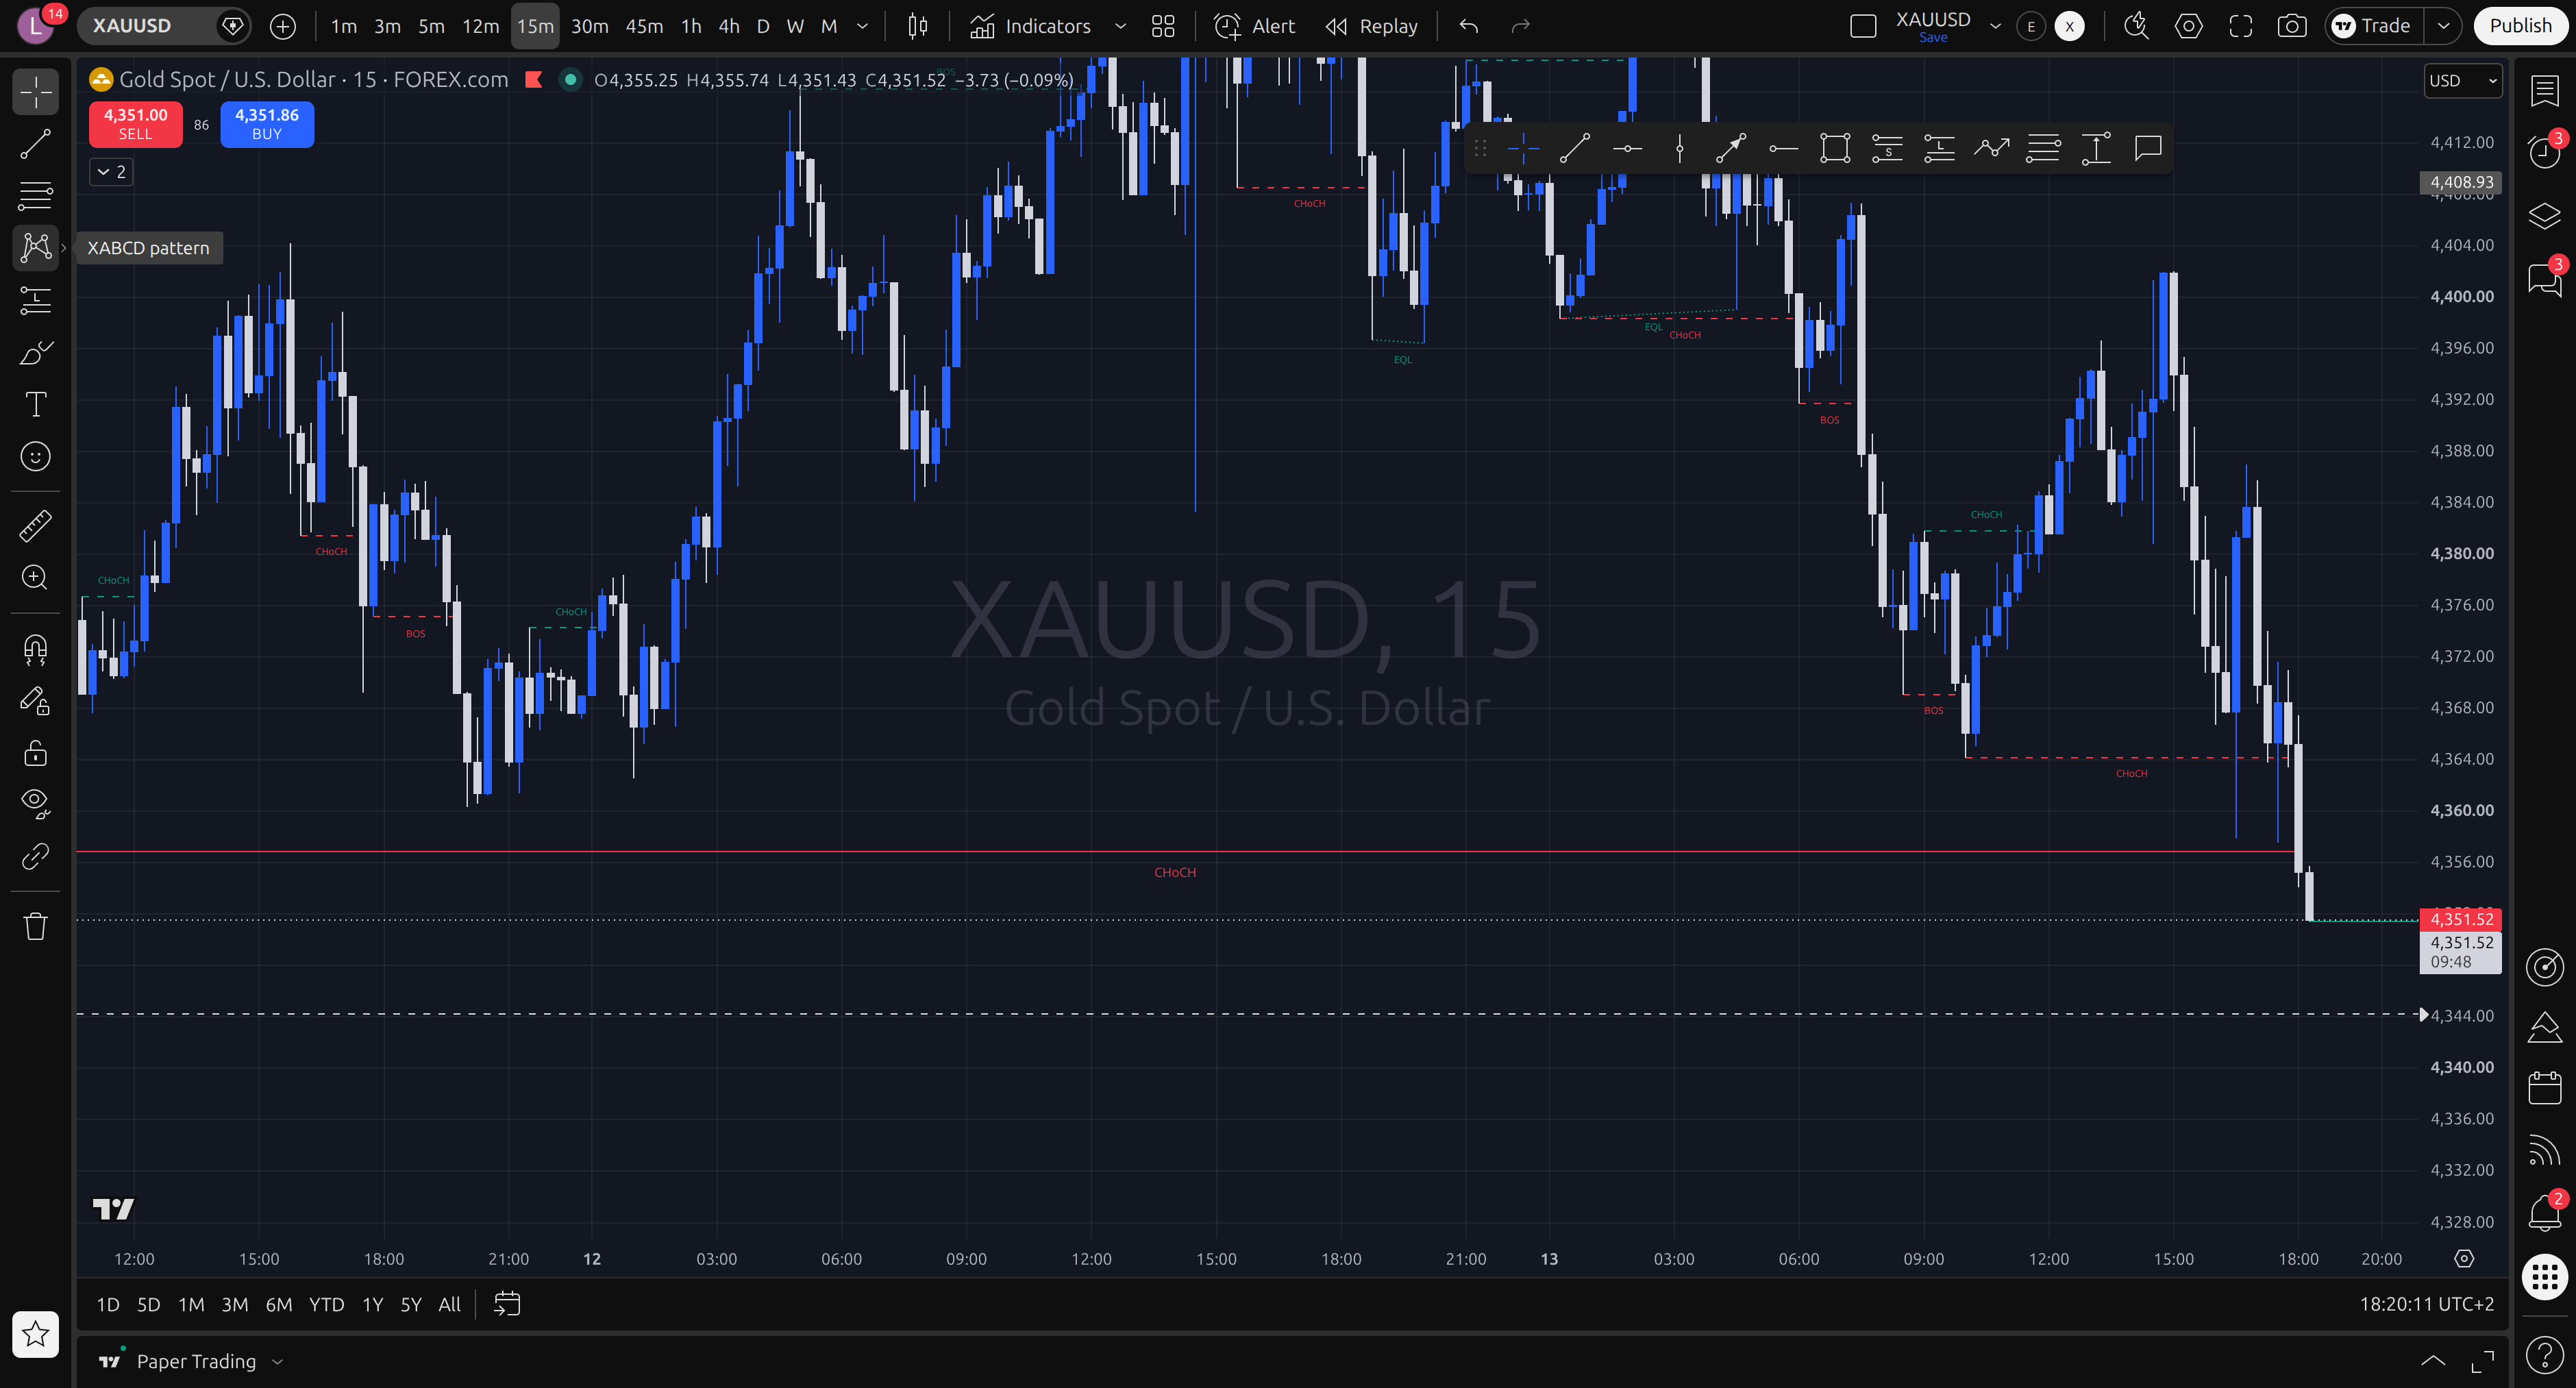
The morning chart, left un-redrawn
The striking feature
Morning thesis vs market reality
End-of-day verdict
What we learned
- Driver that mattered most
- Two of them, and they pulled in the same direction. The rejection of a ten-week high at 4449.81 at half past two in the morning set the tone, and the cross-market split confirmed it: silver broke down 1.34 percent while gold went nowhere, after leading it higher the day before. Metals stopped being bid together and silver went first, which is usually the order. Producer prices at half past two in the afternoon produced a 205 pip candle that resolved nothing on its own, and the real work happened after it, when price rolled over from 4402 to a close below the four hour floor. Gold opened at 4408.93 and is trading around 4351, so the bearish call made at ten this morning was right by about 580 pips.
- Did price respect the zones?
- Almost all of them, and with unusual precision. The 0.764 at 4400.91 was reached twice, once on the print and once at 15:00, and rejected both times, the second by 103 pips. The 4369.72 target was reached at 16:05. The 4h floor at 4356.85 refused price three separate times, at 4357.87, 4358.53 and 4356.83, each turn coming off the top edge of the unfilled demand at 4344.25 to 4356.85, before the 18:00 bar finally closed below it at 4355.25. The one level that was never respected is the one that mattered least: the morning invalidation at 4381.81, which stopped being an invalidation once the fib was re-anchored at midday.
- Carry forward into tomorrow
- Three things. First, the four hour accumulation floor at 4356.85 has now been broken on a closing basis for the first time since the eleventh, on the fourth attempt of the day. The grid for that trade should be anchored on the completed break and the retrace that follows it, not on tonight's candle, and unfilled four hour demand runs 4344.25 to 4356.85 with nothing structural below it until 4313.51. The ladder is armed and server side. Second, the news gate has now skipped a completed winner on two consecutive days, 3.77 times risk on the twelfth and 2.29 times risk plus 4,156 dollars today. That is the single most important open question on this desk and it belongs in the week review as a question about the rule, not about either day. Third, and larger than both: the trader's unconventional trades made 19,903 dollars today while the by-the-book setup, scored at 83 percent and built exactly to spec, made nothing. That is a labelled discretion sample with a number attached and it is the reason this project exists.
The method
Two anchor prices on the displacement leg, and a fixed fib grid derives the whole order: entry floored at the 0.764 that names the method, stop at 1.05, target a fixed span below. R is a consequence of the grid, never a number chosen after the fact. Every read is timestamped and left un-redrawn.